Understanding website analytics
Decoding Your Website Numbers: A Simple Guide for independent Businesses
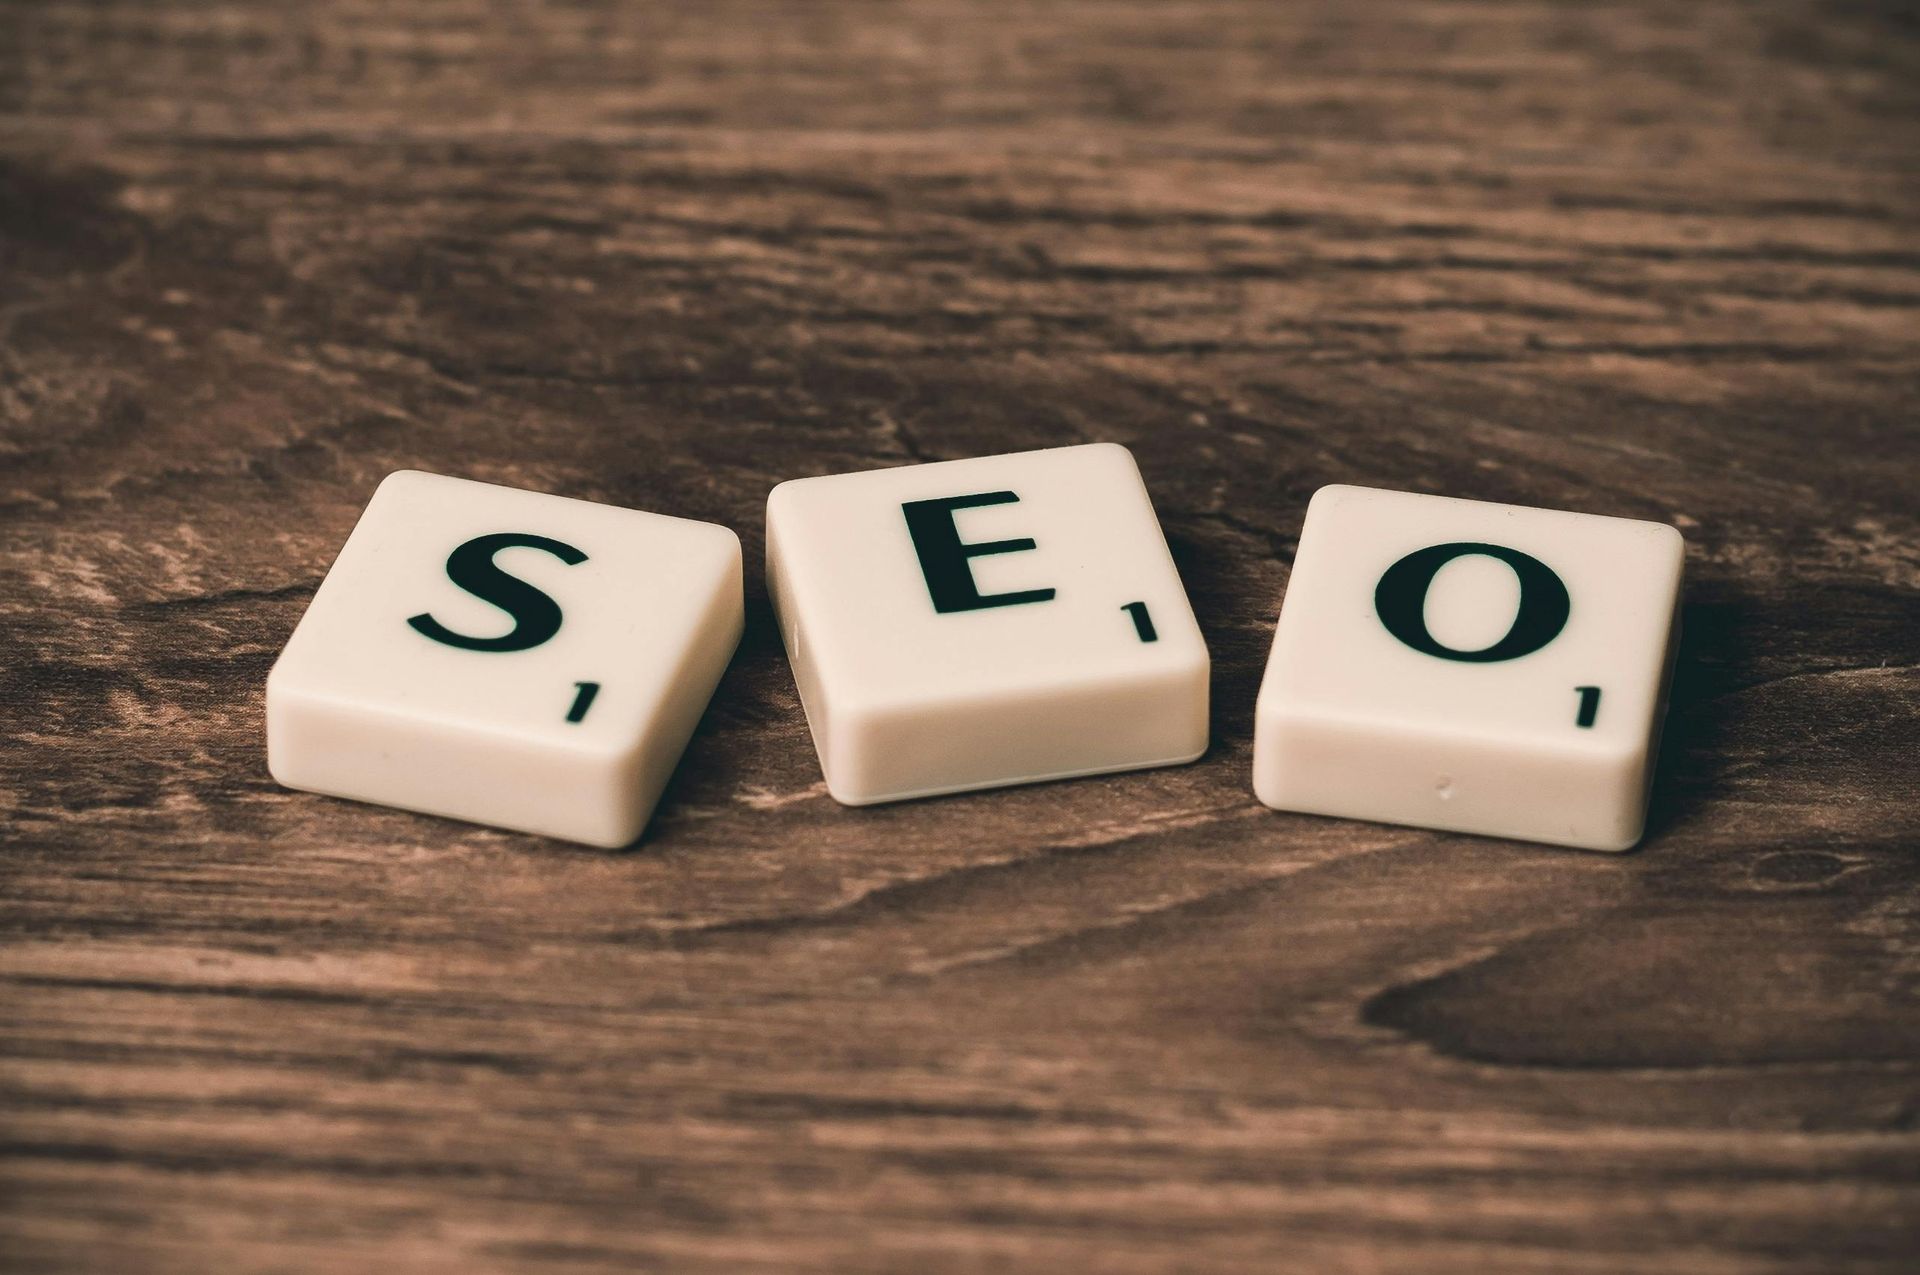
Ever feel like the data behind your website is a secret language? You're not alone! Lots of local businesses find the world of website analytics a bit baffling, especially when it comes to something called SEO (Search Engine Optimisation).
But don't worry, understanding the basics of your website traffic doesn't need a tech degree. Think of it like understanding how many people walk into your physical shop and what they do while they're there.
Today, we're going to break down some common website terms using information from a tool called Independent Analytics.
While different tools might show things slightly differently, the core ideas are the same, and understanding these will help you make smarter decisions about your online presence.
Imagine Your Website as Your Shop…
Let's use a simple analogy to make sense of these numbers:
- Views = People Looking Through Your Shop Window: Every time someone lands on a page of your website, it's like they're glancing at your shop window. If they click through to a few different displays, that's more "views."
- Visitors = Unique People Entering Your Shop: This tells you how many different individuals have visited your website. Even if the same person comes back tomorrow, they're still counted as one unique visitor (unless they use a different device, like their phone instead of their computer).
- Sessions = A Single Shopping Trip: When someone arrives at your website and browses around until they leave (or become inactive for a while), that's one "session." They might look at several pages during that one visit.
- Bounce Rate = People Who Look in the Window and Leave Straight Away: This is the percentage of people who land on just one page of your website and then leave without clicking anywhere else. A high bounce rate might mean your "window display" (your landing page) isn't grabbing their attention or isn't what they were expecting.
- Views Per Session = How Many Displays People Look At During Their Visit: This number tells you, on average, how many pages people explore during a single visit to your website. A higher number here suggests people are interested in what you have to offer and are clicking around to see more.
- Session Duration = How Long People Spend Browsing in Your Shop: This is the average amount of time visitors spend on your website during a single session. Longer session durations can indicate that people are engaging with your content and finding what they need.
Why Does This Matter for Your Business?
Understanding these simple metrics can give you valuable insights into how people are interacting with your online presence:
- Are people finding your website? (High views and visitors are a good sign!)
- Are they finding what they're looking for? (A lower bounce rate and higher views per session and session duration suggest they are.)
- Are there pages on your website that aren't working as well as others? (A high bounce rate on a specific page might indicate a problem.)
Taking the First Step
You don't need to become a data expert overnight! Just starting to pay attention to these basic numbers in your website analytics can make a big difference. It's like keeping an eye on how customers behave in your physical shop – it helps you understand what's working and what you might need to tweak.
At Social Media Academy, we understand that SEO and website analytics can feel overwhelming. That's why we offer support and guidance to local Southport businesses like yours. We can help you understand your website data and use it to attract more customers and grow your business online.
Ready to demystify your website data?
Get in touch with Social Media Academy today for a friendly chat about how we can help!
Blog